Digital Surf Announces Release of Mountains 9 Image and Surface Analysis Software
Digital Surf has announced the release of Mountains 9, a major new version of the company’s leading software platform for image and surface analysis in microscopy and metrology. With version 9 comes a new branch of Mountains software, MountainsSpectral, for correlation & spectroscopy analysis, as well as several new optional modules, new file formats and many new features.
Users of 2D and 3D profilometry, scanning electron microscopy, scanning probe microscopy and spectroscopy, working in a wide range of application fields, will discover a wealth of new capabilities for their image and surface analysis.
“With new version 9, Digital Surf notably extends the Mountains® platform in two directions: full three-dimensional data analysis and spectral analysis” said Christophe Mignot, Digital Surf CEO.
“As far as 3D data analysis is concerned, the addition of surface texture parameters on freeform surfaces now makes it possible to calculate roughness on any type of non-planar part, even on very complex shapes.”“New spectral analysis features provide solutions for correlative microscopy and the combining of chemical mapping and microscopic surface texture. Together, full-3D views and spectral mapping bring further benefits: multi-channel voxel cubes and I(V) spectroscopy data cubes can now be visualized and analyzed.”“These new data types, as well as those that existed previously, are of course interconnected. Thus we reinforce the position of the Mountains platform as the natural tool of confluence and synergy for all microscopy data, from the simplest to the most sophisticated.”Extended Range of Capabilities
– Since MountainsMap was first introduced in 1997, the platform has become an international standard for those working on surface analysis in research and industry, with the majority of manufacturers providing the software with their instruments.
– In 2013, MountainsSEM built on the power and experience of the Mountains platform to bring color and 3D topography to users of Scanning Electron Microscopes.
– MountainsSPIP, launched in 2018 following the merge with Image Metrology’s SPIP, was fast adopted by professionals working with Atomic Force Microscopes and other Scanning Probe Microscopes.
– Now, with version 9, a new product family, MountainsSpectral provides tools for Correlative Analysis and Spectral Analysis.
– MountainsLab, Digital Surf’s multi-instrument solution, comes of age, allowing data from practically any surface measuring instrument (profiler or microscope) to be analyzed with the same software.
Three new modules also make their debut in the version 9 release:
– Shell Topography: bringing surface texture analysis to freeform surfaces (shells)
– Chemical cubes: for the visualization & analysis of multi-channel cubes of compositional data
– IV Spectroscopy: for SPM investigation of electrical surface properties including 3D visualization of datacubes and individual IV curve analysis (including CITS)
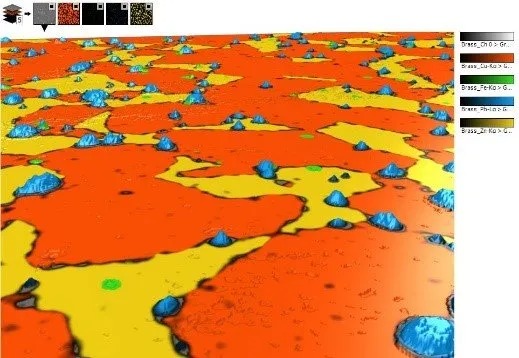
More Data Types Supported3D rendering associating EDS maps with an SEM image
Among new data types that can be loaded using Mountains 9 are point cloud data, allowing users to visualize and analyze data from 3D scanners etc. and multi-channel cubes: for studying the composition of materials in full 3D.
New features for all users
As well as a new-look interface and modernized Analysis Workflow, improvements to all product levels include an image comparison slider enabling quick comparison of different layers/images in the same dataset, a result calculator for calculating results directly in the Mountains interface and cross-product availability of statistics tools for handling large quantities of measurement data.
Ultimate Toolbox for Microscopy & Microanalysis
With the arrival of the MountainsSpectral product family, version 9 opens a new range of possibilities for microscopy and spectroscopy data analysis, in particular for correlative analysis. Multi-channel cubes of compositional data can now be loaded thus allowing users to associate tomography and chemical analysis. Data from different sources (SEM, AFM, EDS/EDX etc.) can be brought together to form single multi-layer datasets. A new color mixing tool allows users to choose which layers of data they wish to bring to the fore. Scanning electron microscope users can now generate spectacular 3D renderings associating EDS/EDX maps or other spectral/compositional data with SEM images or reconstructed topography when available.
For more information: www.digitalsurf.com

 Tiếng Việt
 Tiếng Anh
 Tiếng Hàn
 Tiếng Trung